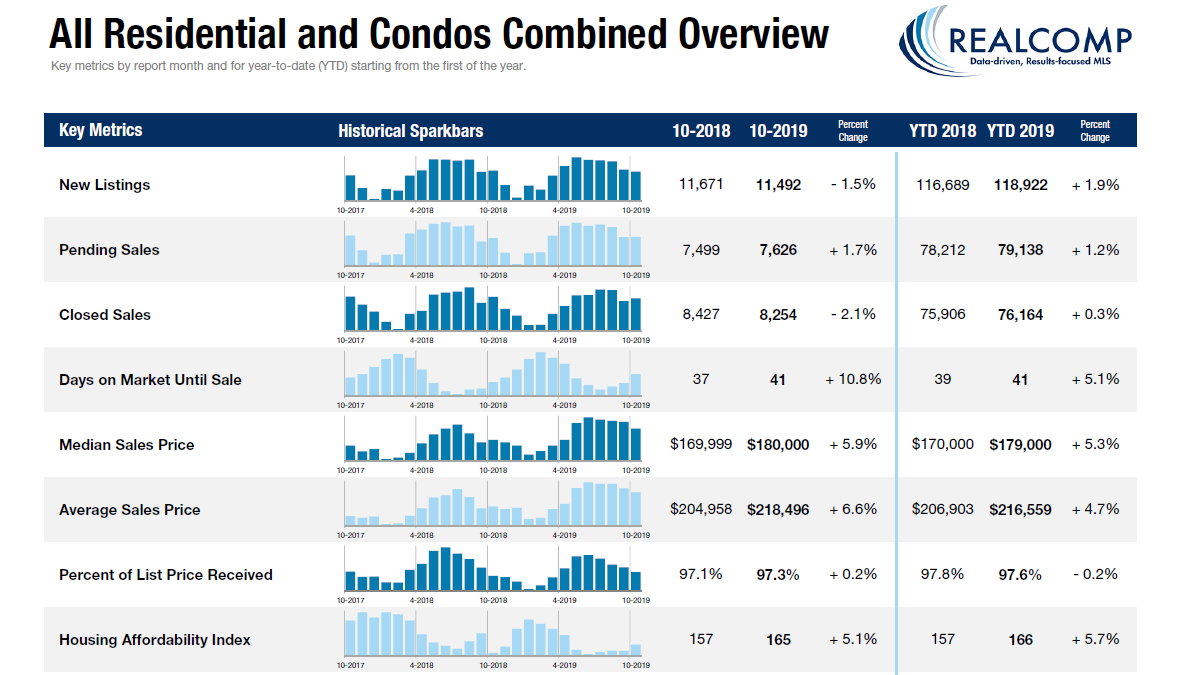
Here are your 8 key metrics for October 2019. New listings, pending and closed sales declined slightly. Days on market, median Sales Price and Average Sales Price all increased in the vicinity of 5% The percent of list price received is flat.
The overall Housing Affordability Index based upon these results is up nearly 6% for the year to date number.
The numbers of new listings are barely up while the days on market also increased almost 5%. The trend is towards a buyer’s market but only very slightly. Pray market rates for mortgages remain low!
These numbers are for the entire MLS covering South Eastern Michigan. These same statistics may be very different in your neighborhood. Contact us if you would like detailed reports on your own neighborhood.
Ask for Scott, 248-629-0808.